Visualizing Boolean functions
Seeing the geometry behind high-dimensional formulas.
I explore two complementary views of random Boolean functions: global UMAP embeddings of Boolean assignments, colored by the fraction of violated constraints, and local 2D slices of a continuous objective. These views help compare CNF and XOR solution spaces and examine the landscape encountered by continuous SAT solvers.
A global view with UMAP
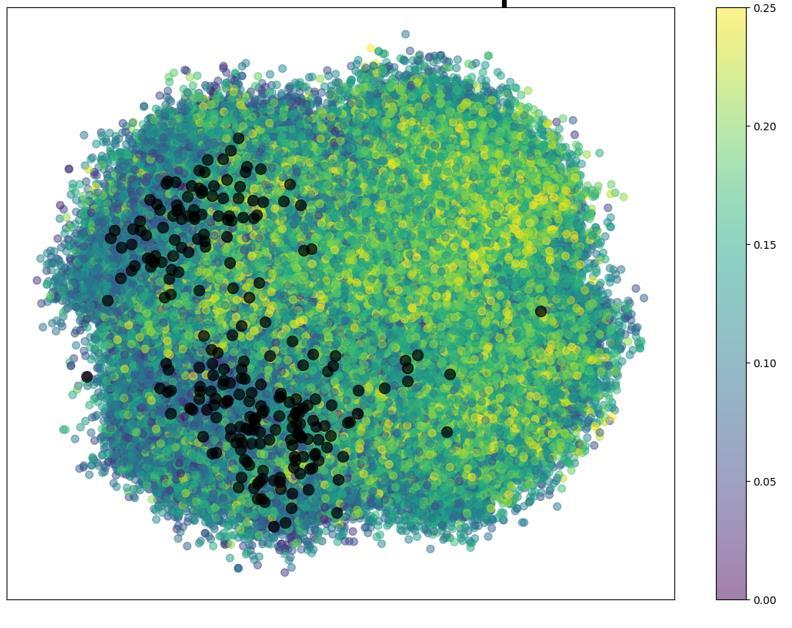
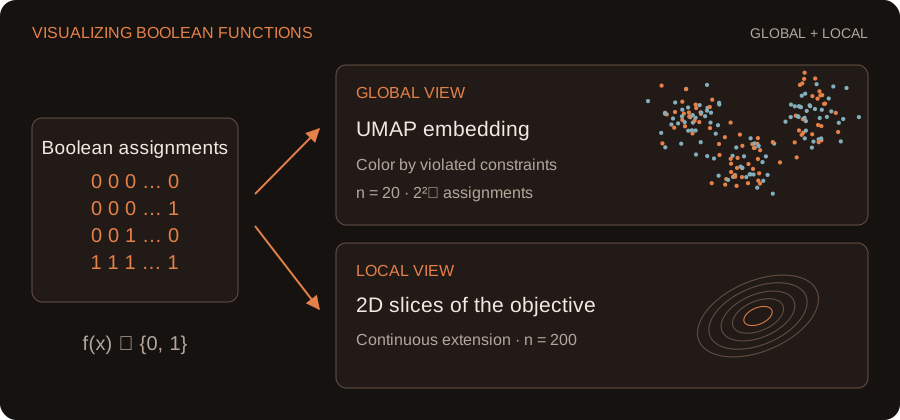
A Boolean function can be viewed as a dataset: each assignment is a point, the variables are its features, and the function supplies a label. My slides explore UMAP embeddings of all 2²⁰ assignments for 20-variable examples. Coloring each point by the fraction of violated constraints helps reveal differences between random CNF and XOR formulas.
A local view with two-dimensional slices
Enumerating all assignments becomes impractical as the number of variables grows. A complementary approach extends the objective continuously and examines a two-dimensional slice through a reference point. The slides demonstrate this view at 200 variables to examine the landscape encountered during FourierSAT’s search.
What the pictures reveal
The goal is to build intuition about clustering, constraint density, and local search geometry. Low-dimensional embeddings and slices are partial views of a high-dimensional object; they help formulate questions rather than replace a proof.